
Economic Simulator
Published in 2000, updated on January 11, 2019
••••••••••••••••••••••••••••••••••••••••••••••••••••••••••••••••••••••••••••••••••••••••••••••••••••••••••••••••••••••••••••••••••••••••••••••••••••••••••••••••••••••••••••••••••••
Please note: Best
viewed at 1280 x 1024 resolution.
Texts in blue italics are "quotes."
Texts in blue underline are links.
Texts with yellow background and
N or
U signify new or updated text.
Texts in black on white background are my texts, including My Fragments (MF#).
►You are allowed to copy from my texts or pictures, providing the copyright is properly attributed to: ©Ben Tamari
www.bentamari.com.
••••••••••••••••••••••••••••••••••••••••••••••••••••••••••••••••••••••••••••••••••••••••••••••••••••••••••••••••••••••••••••••••••••••••••••••••••••••••••••••••••••••••••••••••••••
Simulator Quotes
Silver, N. (2012). "The Signal and the Noise: Why So Many Predictions Fail - but Some Don't." The Penguin Press, p. 9.
"Data-driven predictions can succeed - and they can fail. It is when we deny our role in the process that the odds of failure rise. Before we demand more of our data, we need to demand more of ourselves."
My Fragments - From My Personal Point of View
For the complete list, please see Tamari.
MF1: Fractals relate to attractors like cobblestones in roads. Added: 1 January 2000.
The Economic Cosmos - The Nest

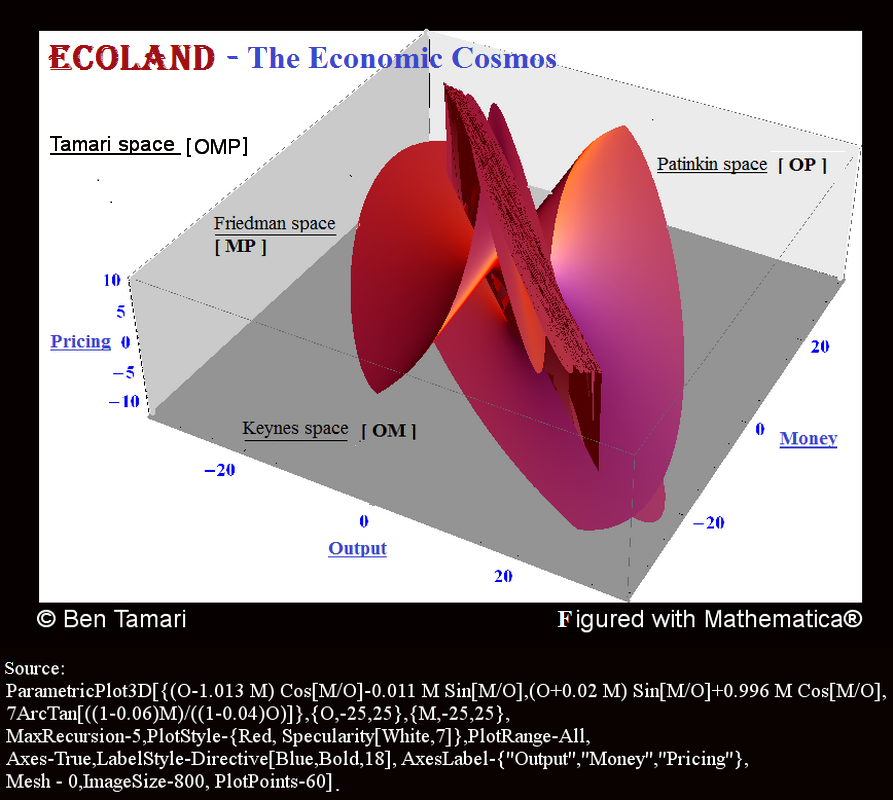

The economic simulator equations
X' = (X - aY)cos(Z) - bYsin(Z), X ≡ O, Output. Conservative/Cremona
Y' = (X + cY)sin(Z) + dYcos(Z) , Y ≡ M, Money. Equations
------------------------------------------------------------------------------------------------------------------
Z' = e + fZ + garctan{ [(1 - u)Y] / [(1 - i)X] } Z ≡ P, Pricing, Feedback equation
Source: Ben Tamari (1997). "Conservation and Symmetry Laws and Stabilization Programs in Economics," p. 17.
N Here is my Exel page EcoSite2013 [for those who young enough to take the mission ahead.]
Comparison among 26 Chosen Countries 1960 - 2013.
The test is Roentgen-like, or MRI-like. The parameters (a-inertia, b-productivity, c-printing, d-adaptation) for each country were found through regressions. The exchange (e), the unemployment (u) and the interest rates (i) are multi-annual geometrical averages, and the indexation parameter (f = 0.01) and velocity of circulation/elasticity parameter (g = 1) are arbitrary and constants. Analysis and study of the variables Output, Money and Pricing (O, M, P) and invariables (a, b, c, d , e, f, g, u, i) of each country show its position in the Economic Cosmos; see the above figures.
To paraphrase Tolstoy, All healthy families (economies) resemble one another, but each pathological family (economy) is unhealthy in its own way.
Figure 1: The Trajectories of 26 Chosen Countries Together, Data 1960-2013.

Table 1: Rates of Change (%) of Growth o, Printing m, Inflation p, Theoretical Inflation p* and Deviation d ≡ p - p*, 1960 - 2013.
|
Country \ Coefficients |
Growth o |
Printing m | Inflation p |
Theoretical Inflation |
Deviation d=p-p* smaller than -5.0 is inflationary depression greater than 5.0 is spillover inflation Australia
| 4.22 8.64
| 5.03 4.42
| 0.61
| Canada
| 3.98 9.32 3.93
| 5.35
| - 1.42
| China 1981-2013
| 10.04
| 19.43
| 5.57
| 9.39
| - 3.82
Colombia
|
| 4.84 20.65
| 15.31
| 15.81
| - 0.50
| Denmark
| 2.10
| 8.99
| 4.94
| 6.89
| - 1.95
| Euro Area 2000-2013
| 1.00
| 7.66
| 2.07
| 6.66 - 4.59
| India
| 5.02
| 13.23
| 7.75
| 8.20 - 0.46
| Indonesia
| 5.28
| 30.51
| 27.43
| 25.23
| 2.20
| Iran
| 5.53
| 19.12
| 14.85
| 13.59
| 1.26
| Israel
| 5.99
| 30.76
| 24.18
| 24.77
| - 0.59
| Japan
| 3.80
| 9.77
| 3.22
| 5.97
| - 2.75
| Mexico
| 4.08 25.20 18.66
| 21.11
| - 2.46 Morocco
| 3.88
| 10.87
| 4.53
| 6.98
| - 2.45
| Norway
| 3.16
| 11.58
| 4.73
| 8.42
| - 3.69
| Pakistan
| 4.33
| 13.48
| 8.17
| 9.15
| - 0.98
| Peru
| 3.51
| 55.18 50.65
| 51.68
| - 1.03
| Philippines
| 4.13
| 14.33
| 8.97
| 10.20
| - 1.23
Russia
1995-2013
|
3.61
| 30.09 |
17.84
|
26.48
|
| - 8.64 inflationary depression
| Singapore
| 7.49
| 10.49
| 2.69
| 3.00
| - 0.31
| South Africa
| 3.15
| 14.06
| 8.33
| 10.91
| - 2.58
| South Korea
| 6.58
| 20.82
| 8.44
| 14.24
| - 5.80 inflationary depression
| Sweden
| 2.58
| 7.77
| 4.68
| 5.18
| - 0.51
| Switzerland
| 2.18
| 6.17 2.71
| 3.99
| - 1.27
| Turkey
| 4.49
37.96
|
| 31.19
| 33.46
| - 2.27
| United Kingdom
| 2.21
| 10.09
| 5.76
| 7.88
| - 2.12
| United States
| 3.06
| 5.69 3.97
| 2.63
| 1.34
Venezuela
|
| 3.33
| 27.53
| 19.37
| 24.19
| - 4.82
| Average
| 4.21
| 17.75
| 11.67
| 13.55
| - 1.88 |
Source: Processed by the author from data in IMF's "International Financial Statistics, Yearbook 2014."
Table 2: The Coefficients a, b, c, d, J/E ad - bc (Jacobian/Ecometer) 1960 - 2013.
|
Country \ Coefficients |
Inertia a |
Productivity b |
Printing c |
Adaptation d |
Ecometer J/E = ad - bc |
|
Australia |
1.0164 |
0.0002 |
5.3212 |
1.0348 | 1.0507 |
|
Canada |
1.0299 | 0.0259 |
- 0.0040 |
1.1028 |
1.1359 |
|
China 1981-2013 |
1.1247 |
- 0.0562 |
0.0760 |
0.9954 | 1.1237 |
Colombia |
1.0376 |
- 0.0109 |
0.0019 |
1.1099 |
1.1516 |
|
Denmark |
1.0295 |
- 0.0531 |
0.0097 |
1.0269 |
1.0577 |
|
Euro Area 2000-2013 |
1.0298 |
- 0.0456 |
0.0413 |
0.9786 |
1.0097 |
|
India |
1.0807 |
- 0.1174 |
0.0110 |
1.0747 |
1.1628 |
|
Indonesia |
1.0415 |
0.0559 |
0.0092 |
1.0915 |
1.1363 |
|
Iran |
1.0280 |
0.0200 |
0.0346 |
1.0176 | 1.0454 |
Israel | 1.0536 |
- 0.1115 |
0.0030 |
1.1138 |
1.1738 |
|
Japan |
1.0413 |
- 36.861 pathological | 0.0000 |
1.0162 |
1.0591 |
|
Mexico |
1.0335 |
- 0.0001 |
1.9899 | 1.0984 |
1.1354 |
|
Morocco |
1.0411 |
0.0000 |
25.0592 pathological |
1.0383 |
1.0812 |
Norway |
1.0397 |
- 0.0576 |
- 0.0079 |
1.1556 |
1.2010 |
|
Pakistan |
1.0597 |
- 0.0001 |
- 5.2432 |
1.1614 |
1.2304 |
|
Peru |
1.0295 |
0.0729 |
0.0020 |
1.1244 | 1.1574 |
|
Philippines |
1.0279 |
0.1251 |
- 0.0007 |
1.1559 |
1.1882 |
| Russia 1995-2013 |
1.0439 |
- 0.0307 |
0.0254 |
1.1219 |
1.1720 |
|
Singapore |
1.0728 |
- 0.0561 |
- 0.0010 |
1.1312 |
1.2135 |
|
South Africa |
1.0259 |
0.0084 |
0.0065 |
1.0840 |
1.1121 |
|
South Korea |
1.0848 |
- 0.1678 |
0.0254 |
0.9878 |
1.0758 |
|
Sweden |
1.0287 |
- 0.0232 |
0.0059 |
1.0463 |
1.0765 |
|
Switzerland |
1.0198 |
- 0.0035 |
- 0.0057 |
1.0859 |
1.1074 |
|
Turkey |
1.0389 |
0.0033 |
0.0221 |
1.1873 |
1.2334 |
|
United Kingdom |
1.0310 |
- 0.0172 |
0.0324 |
1.0223 |
1.0546 |
|
United States |
1.0354 |
- 0.1068 |
- 0.0062 |
1.1259 |
1.1651 |
|
Venezuela |
1.0247 |
0.0000 |
-189.248 pathological |
1.6667 |
1.7082 |
|
Average "World" |
1.0426 |
- 1.3855 |
- 5.9941 |
1.1021 |
1.1488 |
Source: Processed by the author from data in IMF's "International Financial Statistics, Yearbook 2014."
Table 3: The Coefficients: Exchange Rates e, Unemployment u, and Interest i, (%) 1960 - 2013.
| Country \ Coefficients | Exchange Rates (per US $) e | Unemployment u | Interest (lending rate) i | |
|
Australia |
0.28 | 7.03 | 11.037 | |
|
Canada |
0.11 | 8.27 | 7.71 | |
|
China 1981-20013 |
4.12 | 3.25 | 7.34 | |
|
Colombia |
11.23 | 12.03 | 27.28 | |
|
Denmark |
- 0.39 | 7.19 | 5.74 | |
|
Euro Area |
- 2.77 | 9.24 | 2.23 | |
|
India |
4.85 | n.a. | 14.09 | |
|
Indonesia |
7.98 | 4.63 | 18.70 | |
|
Iran |
10.92 | n.a. | 12.77 | |
|
Israel |
20.16 | 8.09 | 72.04 | |
| Japan | - 2.43 | 3.73 | 5.29 | |
|
Mexico |
13.97 | 3.21 | 15.11 | |
|
Morocco |
0.96 | 13.29 | 7.37 | |
|
Norway |
- 0.37 | 3.67 | 9.51 | |
|
Pakistan |
5.94 | 5.65 | 7.86 | |
|
Peru |
41.53 | 7.37 | 289.13 | |
|
Philippines |
5.92 | 8.99 | 14.05 | |
| Russia 1995-20013 | 11.40 | 7.46 | 39.98 | |
|
Singapore |
- 1.67 | 3.41 | 6.75 | |
|
South Africa |
5.04 | 22.79 | 12.87 | |
|
South Korea |
5.53 | 3.37 | 9.04 | |
|
Sweden |
0.44 | 5.62 | 9.49 | |
|
Switzerland |
- 2.88 | 2.82 | 4.63 | |
|
Turkey |
26.03 | 8.95 | 38.34 | |
|
United Kingdom |
1.10 | 6.76 | 7.50 | |
|
United States (US$/SDR) |
0.79 | 6.11 | 7.50 | |
|
Venezuela |
1.12 | 10.60 | 25.47 |
Source of data: Processed by the author from data of "International Financial Statistics, YEARBOOK 2014", IMF.
The Economic Simulator Guide
Eco3 software - an application of the Tamari attractor - enables the study of a country's economy. The software performs a simulation of the country's economy: analysis, planning, prediction and comparison with other nations' economies, based on data in the International Financial Statistics (IMF) for the years 1960-2011, for 26 chosen countries.
The simulator was designed for five purposes:
To simulate the country's economy, for which we need a three dimensional
space called the
Economic Cosmos (the Nest/Tamari space),
or an OUTPUT-MONEY- PRICING [O,
M, P]
space. The Nest/Tamari space includes three two-dimensional subspaces:
Output-Money - Keynes
space [O,
M]
Output-Pricing - Patinkin
space [O,
P]
Money-Pricing - Freidman space
[M,
P]
To compare the performance of different countries' economies according to the same measure and data scale.
To forecast a country's economy.
To investigate the possibility of the increasing/decreasing the quantity of money per output.
To practice the attractor tool, which is the engine of dynamic systems in nature.
How to Operate the Simulator
The default is the Economic Simulator, based on the Tamari Attractor in the Attractors menu. The first country to appear is Ecoland, an imaginary (ideal) country. After that comes a list of another 26 countries (the samples), the last one of which is the average of all 26 countries in the sample called World. The data is taken from "International Financial Statistics, Yearbook 2010."
You can choose another country on the list for simulation and practice. You can also compare different countries by changing the setting in the Accumulated Countries box. The best way to start comparing trajectories among countries is to put the number 3000 in the Iterations box.
If you don't recognize the attractor tool you can get an idea about it by choosing another attractor from the list on the Attractors menu (see also www.bentamari.com/attractors).
By changing parameters, operations, and initial conditions, you will get the feel, sensitivity and spirit of what it is all about.
The Eco method is described in the Ecometry and attractors pages in the site http://www.bentamari.com.